

I developed a program to control a factory with two parts -- a desktop app to set up, manage and control IOT devices, and a website to generate graphs and analysis. The app turns devices on/off based on settings, such as heating the factory before workers arrive, locking doors in the evening and adjusting temperature in different rooms. The desktop app manages and website analyzes data from 21 temperature sensors, 5 humidity sensors and 33 I/O modules placed across the factory at VPSR. I published first version in early 2021, the program runs there to this day.
Showcase program
Showcase graph reports
How does it work?
Graph reports
Graph reports are made using pure HTML & JS & CSS with Asp Net core on the BE. This project is just one of many inside the company's intranet (that I've made). I've used Chart.js for chart rendering. I've used it because the library looks good by default and is easy-to-use. Since then, I've learned how to use D3.js and if I were to start again, I would definitely use d3, just because of how flexible it is.
The program
The program runs non-stop. This program measures the values on the sensors and activates various devices and, for example, heats-up, locks doors, etc,...
In reality, it's two programs, one that's used to measure, set things up, etc,... and the second one to make sure that first one is running. If the second program, called "watcher", (simple script written in python) notices that first program is either not running, or not collecting data correctlly, it sends mails to administrators and tries to correct some issues itself (for example starting everyting up after power outage). Everything it does is reported to admins through email. Usually the "watcher" is able to correct about 90% of all issues itself.
After turning on the app
If you run the program for the first time on a device, a popup window will show up telling you that the program has automatically set SMTP to 192.168.0.1:25. You can set IP and PORT value to SMTP address of the local Microsoft Exchange. Once the application loads, the following screen will pop up:
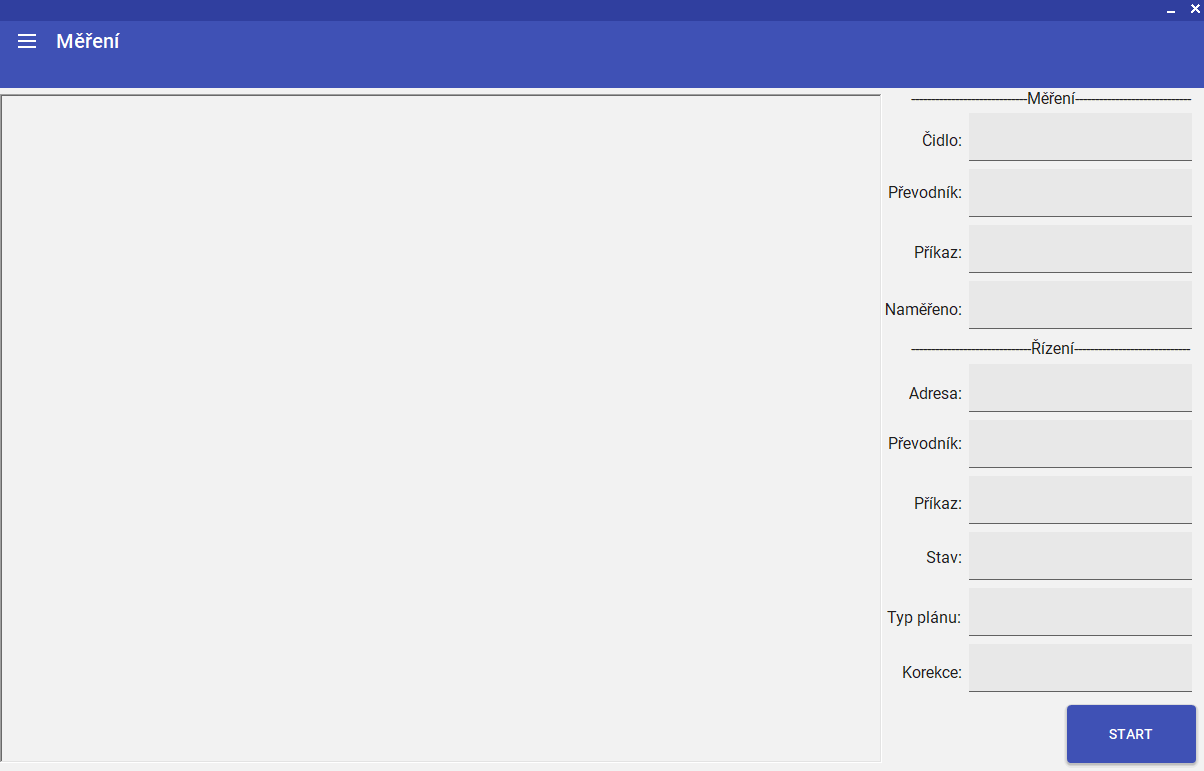
Here you can notice many things. The first is that there is a drop-down menu on the top left. We'll break this menu down more in a moment. Next, we can notice that most of the screen is taken up by the log window. This logging window is inactive until you start Measurement by clicking the START button. Above the start button are the boxes that are filled in when Measurement is on. These boxes show the basic states and values of the sensor the program is currently querying.
After start
When you click on the start button, you are denied the option to go to another part of the application ; log about start will be printed ; a STOP button will appear. To unlock the parts of the app that have locked up, you need to click the STOP button, which is in the same place as the START button was originally.
The program will then check if you have set one sensor that is checked to be the Correction sensor. If you do not have any, or if you have more than one, the measurement start will be terminated.
Then the program jumps into an infinite loop, which runs until someone clicks the STOP button... In this loop, the program repeats the following steps:
- It takes all the sensors from the database and stores them in RAM (List). It then discards the sensors that are not connected from this List.
It then measures the temperature of the Correction sensor to determine the correction and sets the correction according to the hard coded rules.
- Measured > 0 and Measured <= 10, sets the correction to 0.5,
- Measured > 10 and Measured <= 15, sets the correction to 1,
- Measured > 15 and Measured <= 20, set correction 2,
- Measured > 20, set correction to 5,
- Measured < 0, sets correction to 0
- How this correction is applied, will be discussed in a moment, because it is necessary to know what happens before applying the correction.
So, now that we have the correction set up, we run through our saved List full of sensors. The following process happens for all the sensors.
- First we have to measure the values, via the Measurement command, entered individually for each sensor. If the sensor does not respond, 1 error is reported. There have to be 5 errors in order to send an error email to the email addresses in the sensor's "Email" field, stating that the sensor is not working.
- Once we measure the values, we have to decode them from the sensor response. The TypeVelicin field of each sensor is used for this.
- If the sensor has the Coefficient field filled in and the coefficient is not 0, then Measured = Measured / Coefficient of the sensor.
- If the sensor has a control command field filled in, it performs the following steps:
- If the sensor has correction enabled, then: Min = Min - Correction ; Max = Max - Correction
- If the plan is enabled, it will do the following:
- If the sensor has a one-time schedule that is set for that day, the sensor will set an exclusive schedule.
- However, if the sensor does not have an exclusive plan, it will set the normal plan.
- If the sensor has the plan enabled but does not find any plan(s), it will not set the plan.
- If the sensor has a schedule and the current half hour is set to heat, the sensor will heat to Max.
- If the sensor does not have a plan, or the plan is not set to heat, the sensor will heat to Min.
- Next, the program will check if it does not need to report an alarm. Only report an alarm if Temperature <= Min_alarm or Temperature >= Max_alarm
- The last part is balancing the impulses so that they don't get lost in the loops.
- Once all the sensors have been run through, the time is checked to see if the 15 min readings should be saved into database. If so, all values are written to database table. However, if the 15 min has not yet elapsed, the whole process is repeated again.
Drop-down hamburger menu
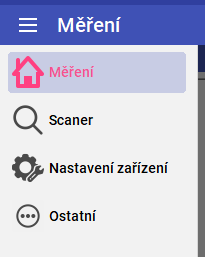
There are several options inside this menu
- Měření - This is the main page where all the important processes happen.
- Scaner - Here you will find tools which help you to scan the network for connected devices. There are 2 modes:
- IP only - In this mode you can enter the IP of the converter and scan this converter to find out all connected compatible devices
- Převodníky + DB - In this mode, you can click on already existing converters in db. The scanner then scans these converters and compares all the devices it found with those in the database
- Nastavení zařízení - Here you will find the option Write / Edit / Delete + test convertors and sensors.
- Ostatní - Here are all the little settings that don't need their own page (Send custom command to sensor, SMTP settings, help instructions, etc,...)
Scaner
Scaner is a tool to scan a certain IP + Port. All it does is try to send an identity query to the IP, according to the Spinel documentation, and if some sensor returns a response, the program displays basic info about the sensor. The only difference, between IP and DB scan, is the way you enter the sensors and how the program display the received data. The scanner can be terminated at any time with the STOP button, even though it hasn't finished scanning.
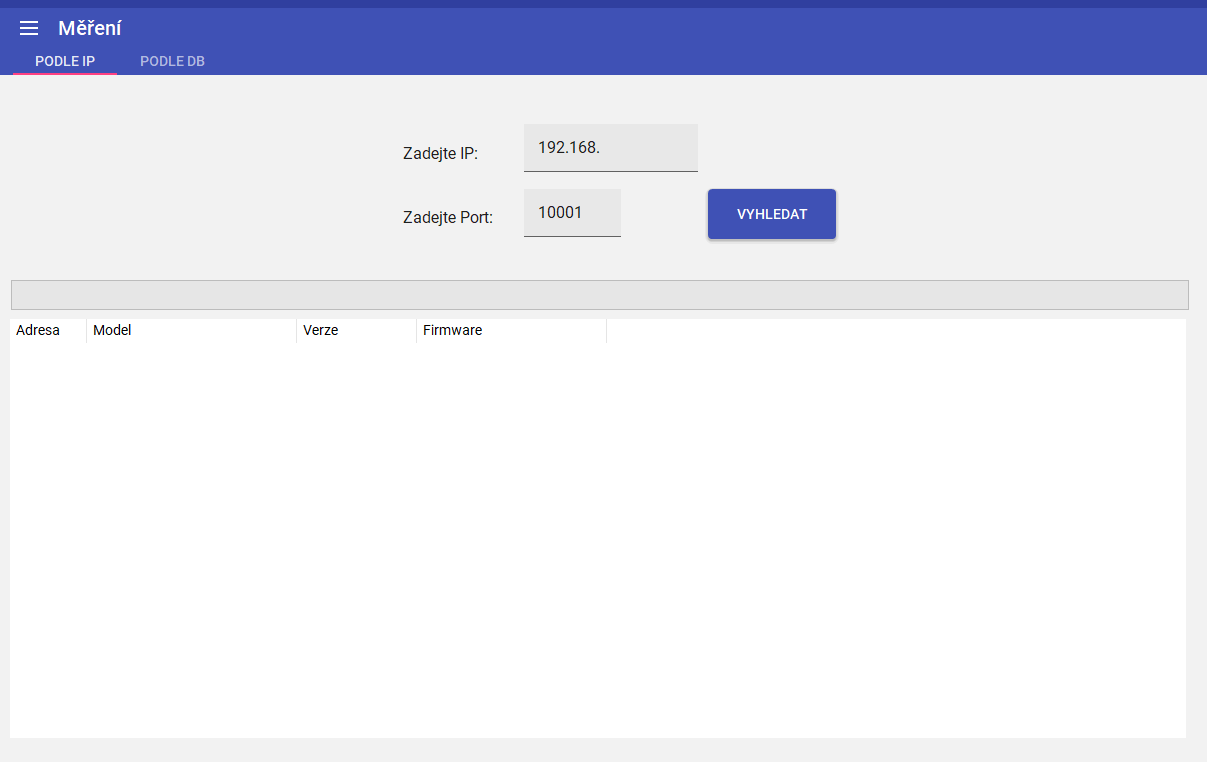
IP Scan
Here the procedure is quite simple. You just enter the IP and do a search. Then you will see in the bottom window all the sensors that have been found + their basic information.
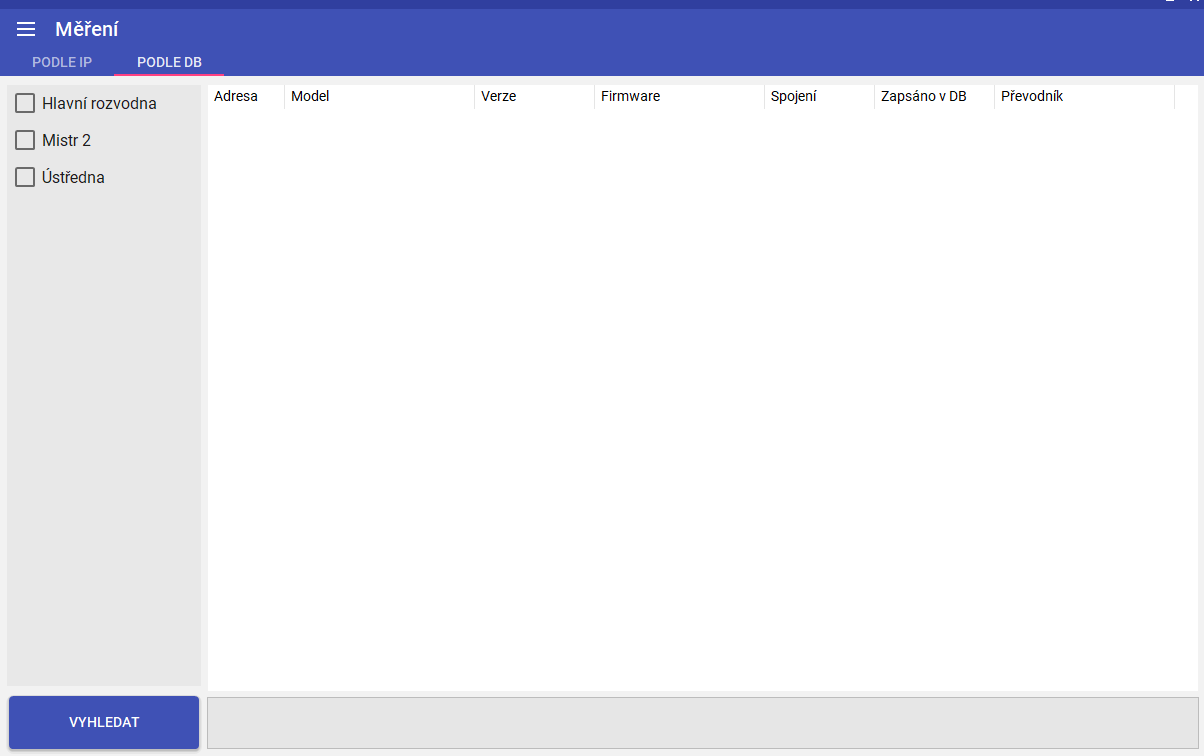
DB Scan
In the "Podle DB" tab, you have your saved converters on the left. Once you click on your converters, do a search and the scan completes, the scan results should come up in the table on the right. The results will include whether the sensors were found, whether the sensors found are active, or what convertor are they on. It will also compare senzors which should be found with the ones that were found and much more...
Device settings
In this section you will find all info about the overall setup/settings regarding converters and sensors.
Converters
On the right in the middle of the screen we can notice a table where all the converters are listed. At this point you have 2 options. Either you start filling in the converter details, and click the SAVE button to add the converter. Or you click one of the converters, modify it to your needs and save it via the SAVE button, with newly modified info. If you have a converter checked, you also have the option to delete it, but you can only delete a converter if there are no sensors associated with it. Once you un-click the converter again, you will stop editing it.
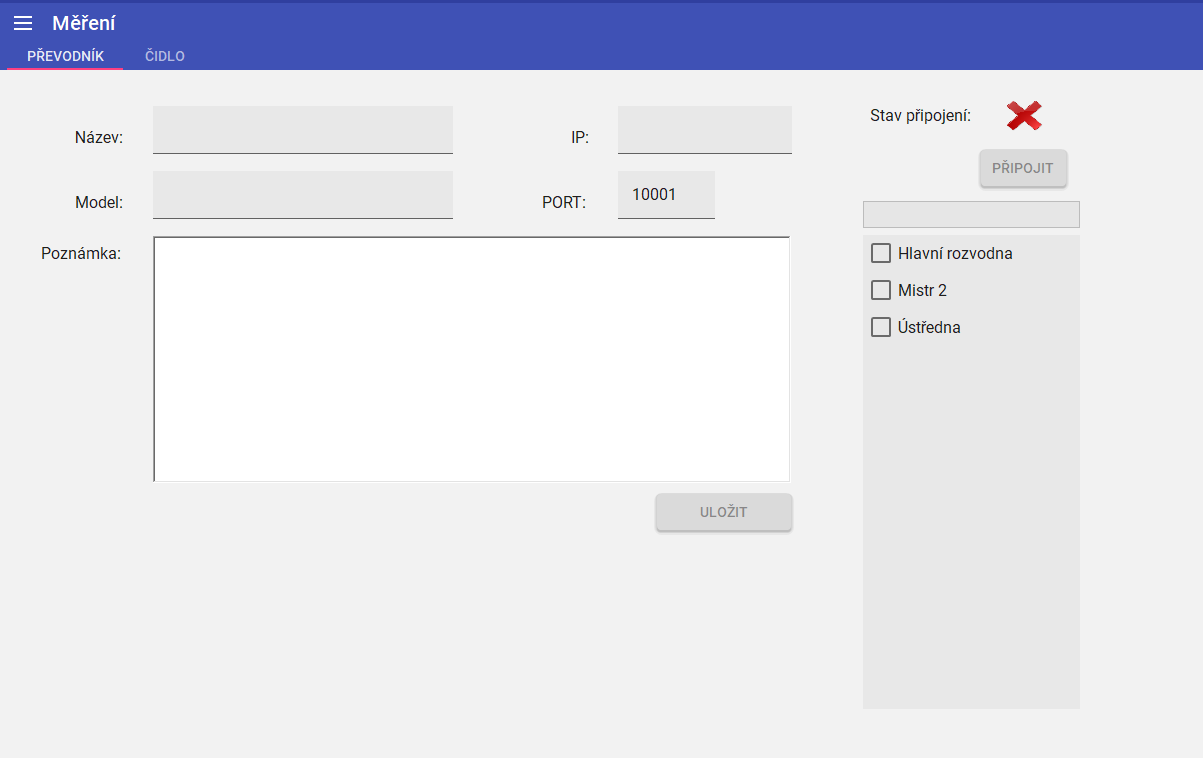
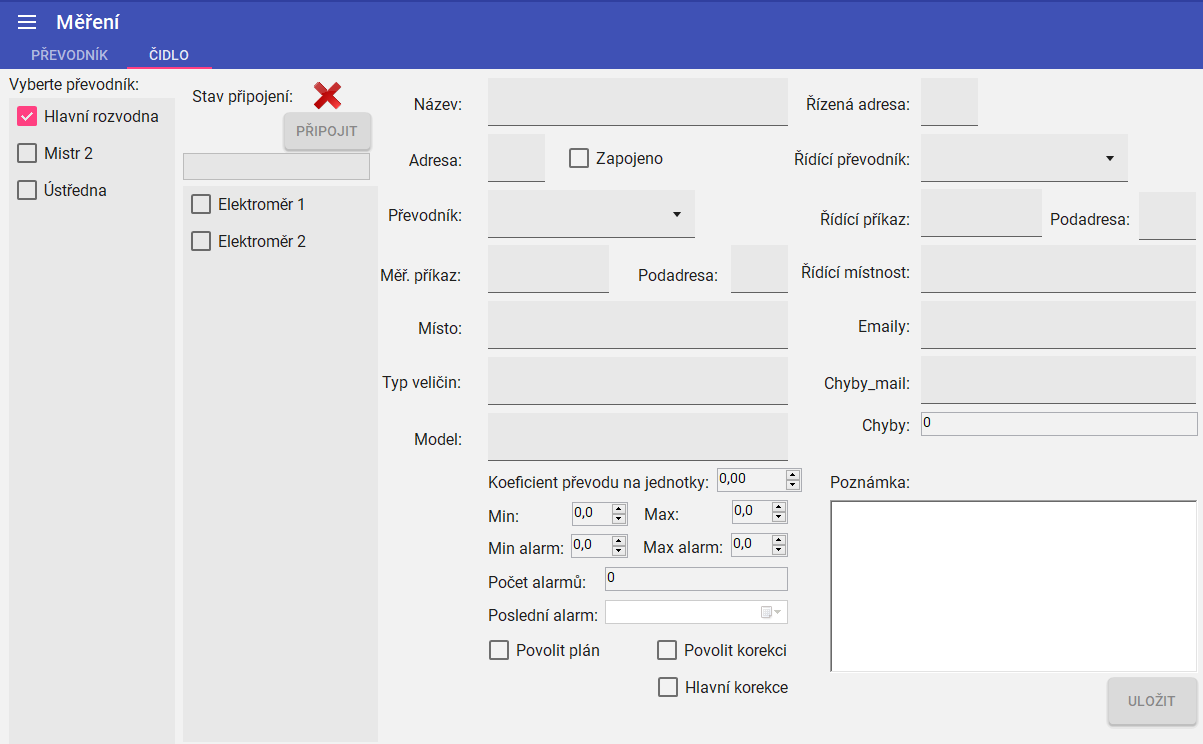
Sensors
We'll start from the left. Here are all your converters. Once you click on one converter, you can select the sensor you want to edit. If you don't want to edit, but rather create, the checkboxes on the right are useless to you, at this point. In order to save a sensor, you have to fill in the fields from Name to Model. However, if you fill in a Control Order, you must also fill in the boxes from Control Address to Control Room.
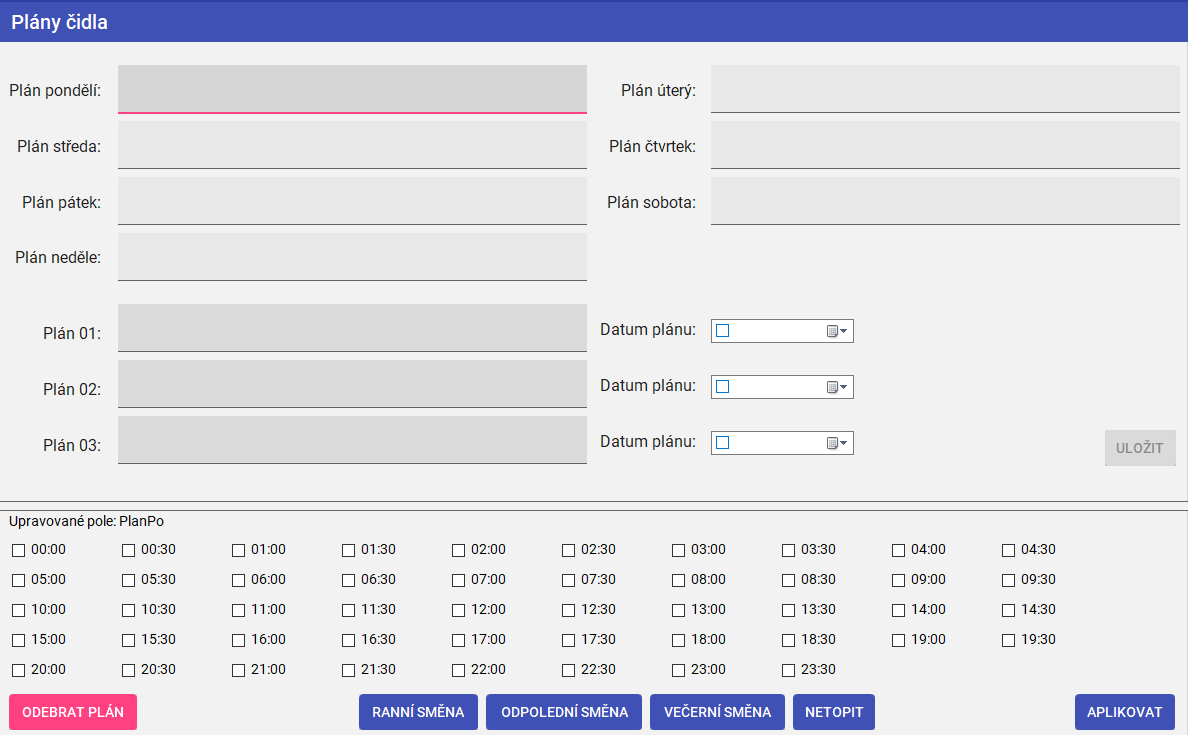
Sensor plans
If you want to set up a schedule for the sensor, you can, but you must first check the Enable Schedule button. Once you check this, you click on the button that appears below this checkbox. If you click this button, you will be taken to a screen where you can set up your plans. Once you click on a checkbox in this window, the plan options will appear at the bottom. You can either manually set them up, or you can choose one of the shifts:
- Morning shift => 4:00 - 12:00
- Afternoon shift => 12:30 - 21:30
- Night shift => 22:00 - 4:30
- "Netopit" => Deletes all ticked times
For exclusive plans, you must first select the date on which should the special plan execute! Remember that the plan is only applied if the sensor has a Control command. Once you have selected a plan, just click APPLY and your plan will appear in the window. Once you have set up all your plans, you click the save button and your plans will be saved + the window will disappear
Other settings
Here are all the little settings that don't need their own page (Send custom command to sensor, SMTP settings)
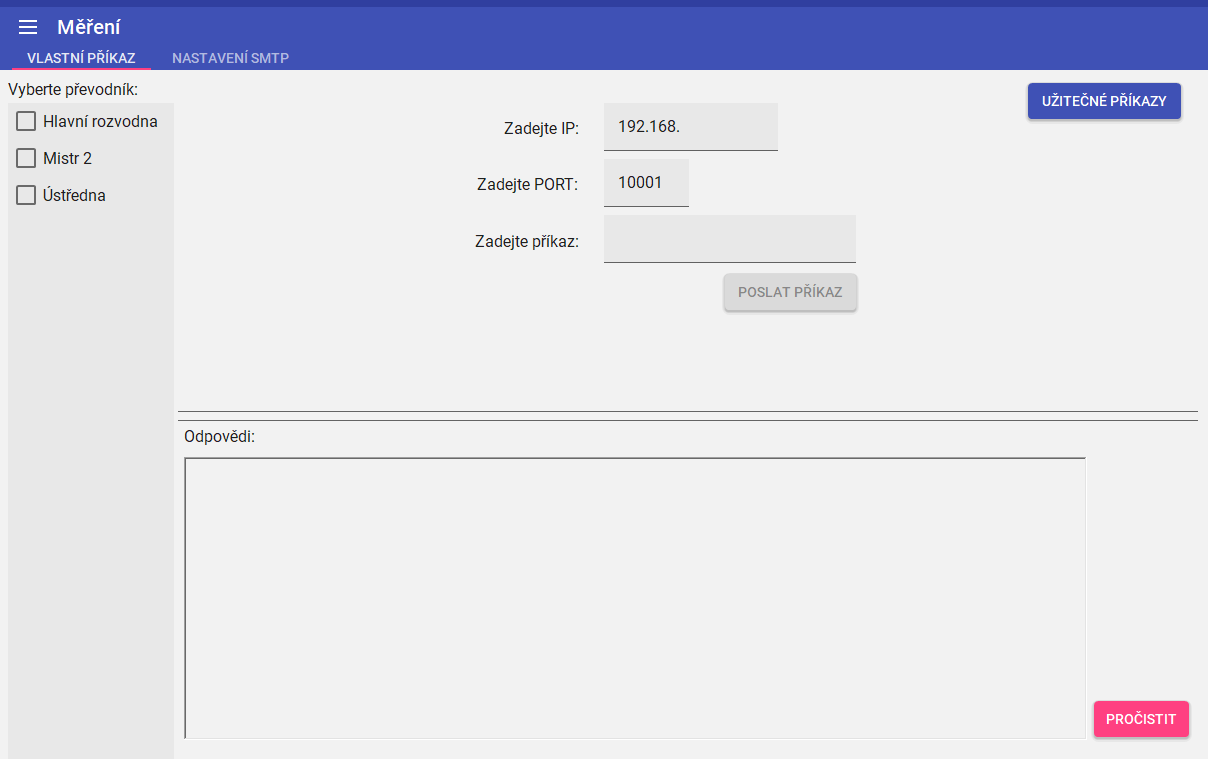
Custom command
On the left you can see that you can (again) choose from the listed converters, or you can manually enter the IP address + PORT of the sensor in the boxes in the middle of the window. Once you have set up your converter, you just send commands and wait for the sensor to respond. These responses will be displayed in the logging window below. At the top right is a UŽITEČNÉ PŘÍKAZY button that takes you to the basic commands help for the sensors.
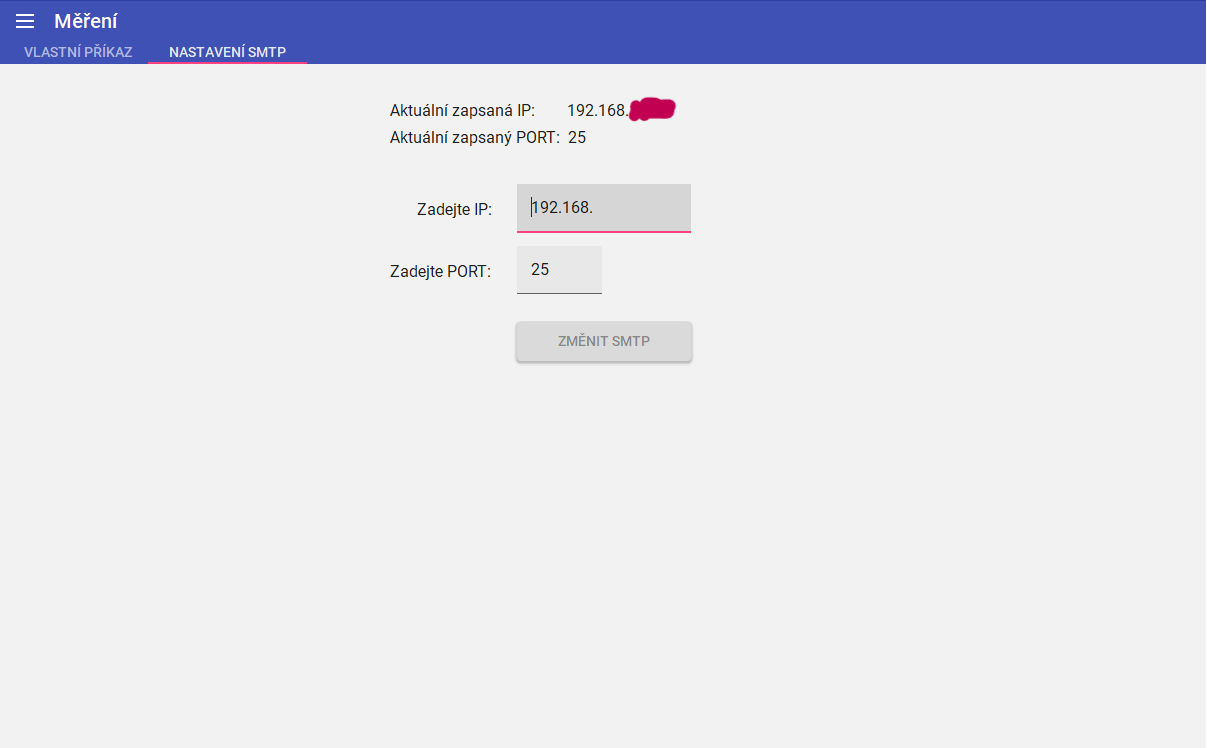
SMTP settings
At the top you will see the current SMTP settings, which you can change by entering the IP + PORT and clicking the ZMĚNIT SMTP button.
I hope you enjoyed this article/blog post!
If you have any questions, problems or want to start a discussion, don't hesitate and write me an email!